Wednesday, 1 December 2010

Disabled students - how many are there really?

It's going to be a long night.

From Maralyn Parker's blog comes this comment from 'John':

Public schools have an acceptance of the full range of students – Government schools enrol 80% of students with a disability.

Between 1997 and 2007:
– 523% increase in students with disabilities in regular classrooms
– 280% increase in the number of students with autism
– 348% increase in the number with emotional disturbance and
– 585% increase in the number with a behaviour disorder

(Linda Graham and Naomi Sweller : International Journal of Inclusive Education titled “The Inclusion Lottery: Who’s in and Who’s out?)

Well Al, it’s easy to see where funding is most needed, however, I’d be pleased to see equivalent percentages in non-gov schools - where’s your data champ?

Right, let's dig into those numbers.

From the DET, we get these numbers:

List of schools with support classes for disabled kids - I count 436 schools.

List of special schools - I count 94.

There are 2230 state schools. That means that only 19.5% can cater to disabled kids with special classes, and a further 4.2% are specifically setup to teach disabled kids (in the private system, 34 out of 916 schools are for special needs - 3.7% of the total).

How many disabled kids are there in the system?

The DET says 18,311, but they include 379 kids in that number who are in kiddie prisons. If we take them out, we get 17,932. As a percentage of the 736,000 kids in the system in total, they amount to 2.4%. If these 17,932 do indeed represent 80% of the total population of disabled kids, then 4,483 must be in the private school system.

Ratios:

State - 17,932 out of 736,000 is 1:41
Private - 4,432 out of 379,000 is 1:85

Let's look at the categories (from page 19 of this report):

Category Total
Mild intellectual - 5026
Moderate and severe intellectual - 4187
Moderate intellectual - 2354
Intensive English - 2241
Emotional disturbance - 1205
Autism - 586
Behaviour disorder - 493
Multicategory - 475
Language - 290
Severe intellectual - 285
Hearing - 240
Physical - 202
Tutorial - 197
Outreach and Access - 46
Moderate intellectual + autism - 36
Reading - 24
Visual - 23
Residential assessment - 18
Deaf blind - 2
Moderate and physical - 2

John tells us that between 1997 and 2007, the number of kids diagnosed with autism went up 280%. There are currently 622 kids in the system classified as autistic - hardly a tsunami.

There has also been a 585% increase in behavioural disorder - we now have 493 of them.

This is the interesting bit - there has been a 523% increase in students with disabilities in regular classrooms.

Of the 17,932 disabled kids, 13,845 are in regular schools. The bulk of these have a mild to moderate intellectual disability, or they require intensive English teaching - these total 9,593 kids. In the old days, unkind bastards like me would have described them as a "bit slow". Schools have always had them - nowadays, we just have nicer terms for it, and I guess there are more social workers and shrinks around to apply a diagnosis.

Those with severe intellectual disabilities or behaviour disorders mainly end up in the special schools - they have 61% of the severely disabled kids.

Here is where the argument gets interesting -we're told that the state system is struggling because it carries the burden of educating disabled kids. However, they only make up 2.4% of the state school population.

How expensive is it to educate a disabled kid?

I had a look at some info from a set of private schools that specialise in teaching autistic kids. From piecing together various bits of data (I won't bore you with the details of that), I am guessing it costs them about $21,800 per year per kid.

How much does the state system get per head?

Primary schools - $14,657 per head
High schools - $18,431 per head

So yes, it is more expensive - but at 2.4% of the school population, it's hardly a budget buster.

Actually, let's add up the extra cost, assuming it costs $21,800 per disabled kid.

Primary schools

$21,800 - $14,657 = $7,143
Disabled kids in primary schools = 5,427
Extra cost = $38,765,061

High schools

$21,800 - $18,431 = $3,369
Disabled kids in high schools = 8,418
Extra cost = $28,360,242

Special schools

Let's just assume these are more expensive to run - I'll pull a figure of $12,000 per kid out of my arse:

Disabled kids in special schools - 4,466
Extra cost = $53,592,000

Total extra cost = $120,717,303

Total state school budget = $11,839,000,000

Extra cost of disabled kids as percentage of total budget = 1%.

My question remains - what the fuck is the DET doing with all the money we give it every year?

School spending - here I go again

I am going to use a number of source documents here from the Department of Education.

First - the cost of education per child in the state school system.

Second - DET fast facts.

Primary schools - total cost per student spent "in school" 2007/2008

$11,148

Secondary schools - total cost per student spent "in school" 2007/2008

$13,977

First thing we notice - it costs 25% more to put a kid through high school.

Next set of facts:

The 2010/11 budget for state schools totals $11,839 billion - that is capital and recurrent spending.

There are 736,000 students in the state system. 438,000 in primary school and 294,000 in secondary school.

Multiply 438,000 primary school kids by $11,148 per head and we get $4,882,824,000.

Multiply 294,000 secondary school kids by $13,977 per head and we get $4,109,238,000.

Add those two together and we get $8,992,062,000. 54% of the budget goes on primary schools and 46% on high schools - even though high school kids cost 25% more per head to educate.

This is $2,846,938,000 short of the 2010/11 budget of 11,839 billion - partly because the per head figures are based on 2007/08.

Let's split that missing $2.84 billion and give 54% to primary schools and 46% to high schools. That will allow us to calculate a per head cost for 2010/11.

Primary schools get an extra $1,537,346,520, taking their budget to $6,420,170,520 - or $14,657 per head.

High schools get an extra $1,309,591,480, taking their budget to $5,418,829,480, or $18,431 per head.

I'm not going to claim that all this money actually makes it to the schools - I reckon at least 30% is swallowed and wasted by the bureaucracy. If I had my way, I'd abolish most of the DET and give every family a voucher for this amount and let them spend it at the school of their choice.

For instance, one of our local state schools is Concord High. It has 850 kids. If I had my way, the Principal would control a budget of $15,666,350 (that's $18,431 multiplied by 850 kids). Instead, the school controls only $2.1 million (see page 6 of their last Annual Report). 87% of the school's expenditure is not controlled by the school.

Compare this with a local Catholic school - Rosebank. It costs Rosebank $15,839 to put a kid through high school. Of this, parents pay $4349 and the state pays $11,490.

Not only does Concord nominally get more funding per head - $18,431 vs $15,839, but the difference in state funding is $18,431 vs $11,490.

Yes, there are private schools that have an annual income over $18,431 per head - but they are not in the majority. I am sick of hearing that state schools are disadvantaged when it comes to funding. They are not - the disadvantage they have is in how the state system chooses to spend that money.

As for disabled kids, the state system has more of them than the independent system. I read yesterday that the state system has 80% of kids with disabilities. However, the state system also has 67% of the kids. Yes, that means the independent system has a lower share - by my calculations, they are carrying half the load of the state system. But - here's a big but - it costs more to teach disabled kids, and clearly, the state system has MORE resources than the private system, so it should carry more of the load, or give more resources to the private system to allow it to take more disabled kids.

The teachers unions and education bureaucrats have spent years mangling the numbers to make it sound like the state system is underfunded. If you compare it to the small number of very expensive private schools, it is. But if you compare it to run of the mill independent schools in place like Walla-Walla, it is very well funded.

Some graphs to illustrate the latest shaky Green vote


Thanks Shadowlands for the shameless plug. You might get a bottle of wine out of it.

Here are two graphs that show that any claims by the Greens that their vote "increased" in Victoria are based on shaky ground. As we all know, there are lies, damned lies and statistics. Well, there are also voting tallies, damned voting tallies and Green claims to electoral triumph. Given enough numbers, you can find one that paints a favourable picture. I don't blame the Greens for spinning the numbers to suit their narrative - I just don't want them to paint themselves as all holier than thou and more moral than the other parties when they do so.

I'm here to keep the bastards honest - ha ha ha ha! The irony of that statement kills me.

I chose Brunswick from the three electorates in question for no other reason than it was the first on the list.

The first graph shows the percentage of first preference votes that each party got. The Liberals and Greens both went backwards slightly, but Labor tanked. Other parties - such as the Sex Party - scooped a much bigger share of the first preferences than 2006. So in terms of the share of first preferences, the Greens went slightly backwards - they did not "improve".


The second chart shows the actual numbers of first preference votes cast for each party. As you can see, turnout is down quite a bit from 2006, even though the numbers enrolled grew strongly. The Labor first preference vote imploded, and both the Greens and Libs went backwards as well. The Libs scored 17% fewer first preference votes and the Greens scored 19% fewer. Labor suffered a 33% collapse.


So what you could say in Brunswick is that the Libs did least bad in protecting their (small) primary vote, the Greens did next least bad, and Labor collapsed like a bag of shit - but still scored the most first preferences and went on to hold the seat based on Liberal preference flows.

Again, the Greens can't use these numbers to claim an "improvement" in their vote. 19% of their core voting base disappeared - and they discovered that their good results in the past have all been at the mercy of the Liberal Party.

If I was Tony Abbott, I'd be visiting Adam Bandt and reminding him that he serves in parliament at Tony's whim. If Abbott wants him out, all he has to do is ask the Victorian Libs to preference him last - in that case, Bandt will be a one term member. Abbott has him by the balls. I'd be squeezing him hard by now.

Wednesday photos

Has anyone in Sydney seen the sun this last week? All I remember is clouds and drenching rain. This is the only photo I have taken since Friday - partly because pulling the camera out in the rain is tricky, but mainly because there has been nothing to photograph apart from the odd soaked jogger and endless puddles.


You'd think that riding in pouring rain would mean that most of the sweat and smells would be washed out of your lycra during the ride. Not so. One of the beauties of lycra is that it dries quickly - I hang my wet gear up at work, and by the time I am ready to head home, it is mostly dry. What I found this week is that it doesn't pay to sniff your jersey - the rain leaches all the sweat to the lower regions, and they smell like a wino's armpit. Seriously - I thought someone had urinated on my jersey when I got a whiff.

Tuesday, 30 November 2010

More on the Green failure in Victoria

My last post was on the macro results across Victoria. Now let's get into the micro results.

Let's go back to this statement from the Green Senator, Sarah hyphen hyphen:

Despite a decisive swing to the conservative side of politics, the Greens still managed to increase their vote in both Houses, even if it is unlikely to result in extra seats. If preferences had flowed similarly to 2006, the Greens would have won the Lower House seats of Melbourne, Richmond and Brunswick.
Brunswick

2006 Green primary vote - 9890
2010 Green primary vote - 8020

Enrolments rose from 39,734 to 43,321 - an extra 3,587 voters, or 9% more. However, the Green primary vote dropped by 1870, or 18.9%.

The Labor vote crashed even harder, dropping from 15,891 primary votes to 10,823. In the 2006 election, Liberal preferences split 25% to Labor and 75% to the Greens. The decision to preference the Greens last clearly got Labor over the line - but I don't think the Greens should be saying that they "increased their vote". A drop in the primary vote of 18.9% is not an "increase".

Melbourne

2006 Green primary vote - 8704
2010 Green primary vote - 8880

They managed to find another 176 primary voters - an increase of 2%. Enrolments grew from 38,853 to 43,916 - an increase of 5063, or 13%. Of those extra 5063 voters, the Greens could only bag 176 - a measly 3%. It makes you wonder whether the GetUp campaigns to enrol young voters really have any impact. They might enrol, but do they bother to get out of bed and vote?

Richmond

2006 Green primary vote - 7900
2010 Green primary vote - 7284

Once again, the Green primary vote went backwards, this time by 616 voters, or 7.8%.

Enrolments went from 38,941 to 42,025 - an increase of 3,084, or 7.9%.

So let's total up the gains and losses across these three key electorates:

Richmond = -616 primary votes
Melbourne = +176 primary votes
Brunswick = - 1870 primary votes

Total = the Greens shed 2310 primary votes.

In 2006, they got 26,494 primary votes across these three electorates.

In 2010, they got 24,184.

So they shed 2,310 primary voters at a time when 11,734 new voters were added to the rolls.

Whilst their share went up, that was because the Labor primary vote imploded. The actual number of people who voted Green went backwards quite badly. At future elections, the Labor vote is likely to pick up again. When that happens, the Green share will decline rapidly.

For instance, take Richmond.

In 2006, the Greens scored 24.68% of the primary vote.

In 2010, that rose to 26.48% - that has been touted as a major improvement.

However, the main change in this election was the Labor primary vote crashing from 14,855 in 2006 to 10,749 in 2010. The other parties went backwards as well.

The Greens share of 26.48% is calculated on a total vote of 28,539. This is well down on 2006, when 32,011 voted.

Imagine if all those Labor voters who failed to get out of bed had actually bothered to get out of bed - which will probably happen at the next election, or the one after that. The Labor vote will go back up to 15,000 or so, and the total number of votes will go to 32,000 or more. If the Green vote stays static - or goes backwards again - then their share of the primary vote will drop to 22% or lower.

At that point, the Greens will have to invent yet another measure of success.

Victorian election - Green vote goes down

I popped over to Catallaxy today to watch the usual bunfight in action. I wasn't disappointed - a thread on Sarah hyphen hyphen quickly went pear shaped.

I'm going to examine this paragraph from hypen hyphen's article in the Age:

Despite a decisive swing to the conservative side of politics, the Greens still managed to increase their vote in both Houses, even if it is unlikely to result in extra seats. If preferences had flowed similarly to 2006, the Greens would have won the Lower House seats of Melbourne, Richmond and Brunswick.
Here is an amalgam of two comments that I left on that thread:

The Greens polled 297,931 votes in 2006 in the lower house.

As of now, they have polled 278,859 – with 95.25% of the vote counted. Extrapolate that to 100%, and they end up with 292,765 lower house votes – fewer actual votes than they got in 2006. Their share of votes went up slightly because turnout crashed between 2006 and 2010. But fewer actual people voted Green at this election.

Similarly, in the Upper House, the Greens got 314,847 votes in 2006.

In 2010, with 96.11% of the vote counted, they are up to 293,222. Extrapolating that to 100% gives you 305,090.

Hmm.

2006 – 314,847
2010 – 305,090.

Somewhere along the way, 5000-10,000 Green voters have dropped off the face of the earth. Percentage-wise, they have gone up. People-wise, they have gone backwards. They shed just over 3% of their voters between elections.

I wouldn’t say that their support is “on the rise” based on those figures.

Let's look at that again:

Lower house
2006 - 297,931
2010 - 278,859
Loss of voters = 19,072
Percentage drop in raw votes = 6.4%

Upper house
2006 - 314,847
2010 - 305,090
Loss of voters = 9757
Percentage drop in raw votes = 3.1%

In 2006, there were 3,353,845 enrolled voters. Turnout was 92.73% - 3,109,907 turned up and cast a vote.

In 2010, the number of enrolled had risen to 3,582,232 - an increase of 228,387 - or 6.8%.

However, only 2,804,304 bothered to vote - a drop of nearly 10%, which is made worse by the 6.8% increase in enrolments. if enrolments had not increased one bit, that would mean 305,603 people stayed in bed compared to 2006.

However, because enrolments went up by 228,387, it means that 533,990 stayed in bed.
What happened to those votes?

Informal - lower house
2006 - 141,914
2010 - 139,438 (scaled to 100% of the count)
Decrease in informal = 2,476

Libs - lower house
2006 - 1,022,110
2010 - 1,080,645 (based on scaling up 95% of the counted votes to 100%)
Increase in votes = 58,535, or 5.7%

Labor - lower house
2006 - 1,278,046
2010 - 1,020,818 (based on scaling it up again)
Loss of votes = 257,228, or -20%

Nationals - lower house
2006 - 153,299
2010 - 195,075
Increase in votes = 41,776, or 27%.

Family first shed about 80,000 voters and "People Power" and the CEC vanished between elections, taking 20,000 votes with them.

I'd characterise this election as one where the Libs barely held their ground, but won because Labor went badly backwards and the Greens went backwards as well. The Libs got out and voted - perhaps out of duty, perhaps because of the stance against the Greens - whilst many Labor voters could not bring themselves to vote for any party, so they stayed in bed. They failed to drift to the Greens, which is why they went off like a damp squib.

The Nats are the big surprise - 27% more people voted for them this year.

Thursday, 25 November 2010

Thursday photos

Is it Thursday already? Must be - I fell asleep on the couch not long ago. By the end of a week of getting to and from work under my own steam, I'm knackered.

Four amigos waiting at a light. We have a nice mix of cycling styles here, and the nice thing to see was a few of them chatting to each other. Cyclists are a much more social bunch than any other group of people moving from A to B. If a cyclist pulls up beside you and starts talking, that's nice. If you're on the bus or train and the person beside you decides to start talking, there's a 98% chance they're insane.


Here are two of them, having a very pleasant chat as they wander along under the trees. I think the bloke on the right rides in from just over the bridge - he parks his car in a free parking zone, unfolds the bike out of the boot and off he goes. The bike looks fine for a short trip of only a few kilometres, but I wouldn't want to do much more than that. He fairly motored along though.


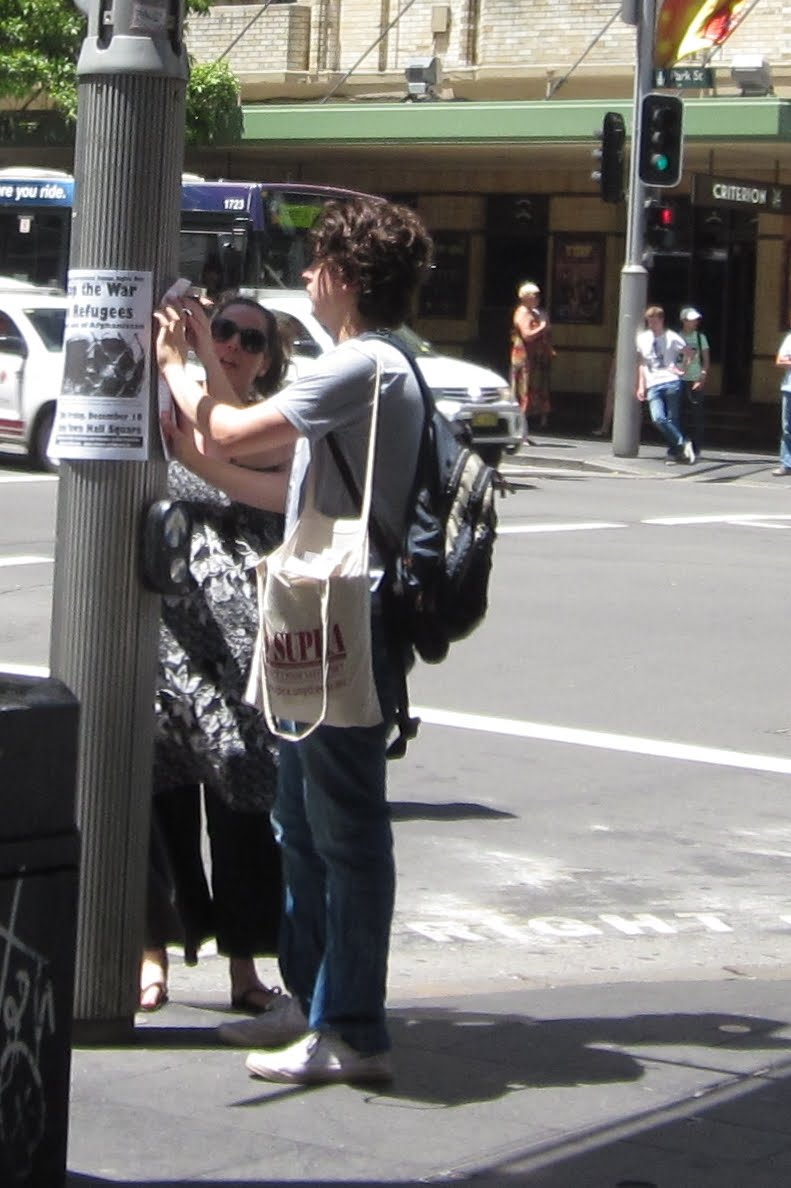
Ever wondered what sort of people stick those "free the refugee" posters up on poles? Well, here we have a pair. She was short and fat; he was pimply.

Why do they think that we are at "war" with refugees, and how will bringing the troops home help? If we were at war with refugees, we'd be machine gunning their boats and burning them to the waterline. Our detention centres would not be packed with people the Navy plucked from the water - they'd be empty, because everyone who tried to enter would be dead. Enough of the hyperbole - we are not at "war" with refugees. It takes a uni student to be stupid enough to believe that sort of tripe.

Tuesday, 23 November 2010

You'd have to be nuts to go to Uni

Seriously - University can drive you mad.

RATES of serious mental illness are more than five times higher among university students than in the general population, according to research from the University of Queensland.

Almost 84 per cent of students reported psychological distress, compared with 29 per cent of the general population. More than 19 per cent of students surveyed suffered from a serious mental illness. In the general population, the rate of serious mental illness is about 3 per cent.
Here's what I want to know - when these people leave uni, do they still have a mental illness? Or does leaving provide a magic cure?

Christ on a bike - these sorts of surveys really get up my nose. Going to uni is not supposed to be easy - it's supposed to be bloody challenging, and it's supposed to weed out the stupid and the lazy and the useless. One would hope that the sort of people that finish Uni and get a good degree are the best of the best. Uni should be stressful and difficult, because it should stretch and challenge the minds of students. Either they can hack it, or they can't. If they can't, they should quit and take up plumbing.

I was under a fair bit of financial stress at Uni - mainly caused by my drinking. Once I got a job that required me to work until midnight on Friday and Saturday, the problem went away - I was unable to go to the pub - and that was that.

I was also under quite a bit of exam stress, because I drank like a fish and did hardly any work. It's pretty hard to pass your exams under those conditions - although I'm happy to report that I did score a few A's and B's. But not a lot. If you've spent most of the term drunk or asleep rather than in lectures and tutes, you'll probably feel a lot of pressure a few days out from your exams. I certainly did - I still have the odd nightmare about it over 20 years later. The fact that I passed all those exams - bar one - should clearly mean that my uni course was too easy. I should have been washed out like Bluto.

The problem that many modern day students might be having is their discovery that they don't really belong at Uni. Their parents and schools have coerced them into attending, and once they get there, they're trapped. That's certain to mess with your head.

Tuesday photos

I was wrecked on Monday - not that I did anything of note over the weekend. It was just one of those days where you wake up shattered. I was in such a feeble and horrible state, I figured that I had to ride into work just in order to wake up. If I caught the bus, I'd have jumped off after a few minutes and gone home to bed. The ride in did help, but I was slow as a wet week. Worse than that, I was spotted being slow. There was a rude text message on my phone when I got to work, asking if I was normally that sluggish.

The ride didn't wake me up that much - I fell asleep in a meeting during the morning. Twice. Thankfully, there was no snoring. I think.


A line of three head into town this morning. I would have been content to sit on their tails - I was still not in great shape - but they were hubbards! I managed to keep my eagerness under control for about 10 seconds, then I took them out one by one. I am just not geared for cruising. It's flat out....until I blow a gasket.


Two different styles - the guy in front has all the good gear on, whilst the bloke behind is going home wearing a business shirt. Hey, if you don't have far to go - why not?


Cruising through Pyrmont on a beautiful morning.


Hello girls! I was busted taking their photo - although I think she was more intent on looking at cars coming up behind us.

Notice the pink and red and green "Christmas" banner dangling from the lamp post? I've looked at a few around town, and not one actually seems to have anything to do with Jesus and his birthday. Bloody PC maniacs.

Sunday, 21 November 2010

How gay friendly is your electorate?

Vexnews never ceases to amaze. Andrew Landeryou has managed to dig out a chart listing every federal electorate, along with the percentage that think that homosexuality is immoral. Go have a look at the chart, and read what he has to say.

We're in the electorate of Reid. 30.6% of those surveyed in this electorate think being gay is immoral.

I was a bit shocked to read that, but then again, this is a diverse electorate. Down the eastern end in Drummoyne, I'm sure the percentage who think being gay is immoral would be in single digits. However, over here in Five Wog, being gay will probably get you bashed at 1am on Saturday outside the local pub. Five Wog, funnily enough, is full of wogs - Italians and Greeks. Machismo rules supreme. I'm sure all the gay wogs decamped to saner pastures a long time ago.

The far western part of the electorate takes in Auburn - a very Muslim area. The percentage out there that think being gay is not immoral is probably in single digits.

Here's something of interest, given that Bob Brown comes from Tasmania. Tasmania has five federal electorates. Three of them have "immoral" percentages over 34% - Bass (36.8%), Braddon (35.1%) and Lyons (34.8%). These are all in the top fifth of "immoral" electorates - those that aren't very gay friendly.

Franklin (26.3%) and Dennison (20.2%) and down the quieter end.

It's interesting that the Greens are pushing gay marriage, given that the home state of their top dog is possibly the most unfriendly towards gays in the nation!

Spending, spending, spending

Every now and then, I like to spend a bit of time trawling through a mass of government statistics in order to try and get a better understanding of where our tax dollars are going. I've got to tell you - it ain't easy. I can see why journalists prefer to get briefed by politicians and public servants, and to lap up press releases instead of trawling through the bowels of government fact sheets. It's a complete chore.

A constant refrain from the "we hate private schools" crowd is that private schools get too much money from the government. This topic always raises its head at my favourite education blog, run by Maralyn Parker.

As most funding for private schools comes from the federal government, I thought I'd start by analysing whatever numbers I could find on the DEEWR website (that stands for some enormous department that was cobbled together by Julia Gillard before she knifed Saint Kevin.

Here's my first finding - the pubes at DEEWR are absolutely amazingly good at hiding figures from the public. They squirrel things away in places where you'd never think to look. They're also very good at not providing up to date information - the latest information on capital grants to state and private schools dates from..... October 2007. Gee, I remember there being an election in December 2007, and the new government talking a lot about "openness" and so forth.

What a crock that turned out to be. Here's a tip for those that have come to hate Julia Gillard for the MySchools website (which rolls up all sorts of data on state the private schools) - Julia loves to reveal data on what other people are doing, but hates to reveal data on what she is up to.

Either that, or she's kept her public servants so busy for the last 3 years, they haven't had a chance to annually update the data once a year.

Data on state school capital grants can be found here, and private schools here.

Here's the guts of it.

In 2007, the feds handed out $107 million to 192 private schools and $189 million to 142 state schools in capital grants.

The average private school got $560,000 and the average state school got $1.3 million.

I've attempted to present the data in two graphs. The first shows the distribution of grants by size for each school type. Private schools are in blue, state in red. It's not entirely clear from this graph, as I had to truncate the horizontal axis, but private schools clearly got a lot of "small" grants, whilst some state schools got some very hefty grants - up in the $8 million range.


The next graph shows the total amount granted by grant size. When you look at the first graph, because the blue (private) lines are taller, you're probably thinking the private schools are getting all the cash. However, when you look at the graph below, you can see that massive chunks of grants are being spent at the high end - in the $2 million to $8 million range - where the state schools get the most.

This data is for NSW only by the way.

Now the "we hate private schools" brigade usually clouds the issue by announcing that great wads of cash are being thrown at "elite" private schools, and that this is "wrong".

Here's a random sample of private schools that got money, and where they are located:

  • Clancy Catholic College, West Hoxton
  • Green Valley Islamic College, Green Valley
  • Vern Barnett School for Children, Forestville
  • Qibla College, Minto
  • Sule College, Prestons
  • St Therese Primary School, Padstow Heights
  • All Saints College, Bathurst
  • James Sheahan Catholic High School, Orange
  • Mountain View Adventist College, Doonside
  • St Bishoy Coptic Ordthodox College, Mount Druitt
  • South Coast School for Children with Autism, Corrimal
  • St Paul's College, Walla Walla
  • All Saints Catholics Boys' College, Liverpool
  • St Ignatius' School, Bourke
I could go on and on. If you're interested, have a look at this spreadsheet - it lists them all.

Those suburbs and schools don't exactly sound like bastions of privilege to me.

Just out of interest, I decided to delve deeper in St Paul's College, Walla Walla - because I have no idea where Walla Walla is. It turns out it's somewhere near Albury-Wodonga.

It's a Lutheran school with 215 kids. Annual fees range from $4648 to $7300, with the average being $6053. All the numbers from here on in are 2009 numbers.

As we know how many kids are in each year thanks to the annual report, we can calculate that fee income from parents comes to $1.3 million - this is 45% of all income.

40% of their income comes from the state government and 14% from the feds. This is all in the annual report.

Those of you that remember your maths will know that if $1.3 million is 45% of their total income then 100% of their income is $2.89 million.

We can then calculate 40% of that as $1.15 million (state contribution) and $405,000 (14% federal contribution).

Dividing those numbers by 215 kids, we find that:

  • Parents chip in an average of $6,053
  • The state government chips in $5,381 per kid
  • The feds chip in $1,883 per kid
Total taxpayer contribution is $7,264.

Total of parent and taxpayer contribution is $13,453.

I've blogged on this a number of times, but in NSW in 2010/11, the average spending per state school student is a whopping $15,229.

You can calculate this yourself by simply looking at the NSW DET Fast Facts sheet.

It says that:

Total recurrent expenditure on state schools is $9.296 billion
Total capital expenditure on state schools is $1.913 billion

Add them up and you get $11.209 billion.

The fast facts sheet also says that there are 736,000 kids enrolled at state schools. If you divide $11.209 billion by 736,000, you get $15,229 per head.

Of that $15,229, the parents pay nothing - state and federal taxpayers pick up 100% of the tab. (Yes, state schools do levy additional fees, but you don't have to pay them if you don't want to).

Of course not all that $15,229 actually makes it to each and every state school - a massive amount, perhaps 30% or more, gets swallowed by the bureaucracy - allowing state schools to constantly cry poor.

Back to our Lutheran school out in the sticks. It educates kids for 12% less than the state system does ($13,453 vs $15,229), and it does that whilst getting 53% less funding from the government.

Except there's more - the figure of $15,229 is an average across the board figure for state schools. It actually costs about 25% more to educate a high school kid than a primary school kid, so the actual amount of money going into the state system per high school kid is well over $16,000.

Yet somehow, the "we hate private schools" brigade manages to ignore private schools like our Lutherans in the sticks when discussing funding (and how little these schools get in comparison to state schools), and instead wheel out the high fee "elite" schools, as if they are representative of all private schools.

What I find sickening is that the state school system is not short of money - but the state schools are. Somehow, the system manages to chew up a lazy few billion dollars per year, and at the same time, the "we hate private schools" brigade blames the private schools for the problems of the state system!

Madness.

Saturday, 20 November 2010

Odd looking unrinal

I don't get down to the flash end of town much, so when I am down there, I am one of the few that bothers to stop and sample some of Sydney's artistic delights. One of them is the P&O fountain, which is perhaps more famous today for the part it played in a 1960's obscenity trial.


Here's some better photos of interesting things to see in Sydney. If this sculpture takes your fancy, here is a slideshow of all the artist's work. Interestingly, he did a crucifix for the Royal Military College, Duntroon in the mid 1960s - but I can't find a photo of it anywhere.


I am a bit uncertain as to whether I ever wee'd in this one drunken night during my misspent youth. I suspect I might have. I'm sure I'm not the only one to have done that.
Two other items in these early issues incurred the wrath of the NSW police. One was Martin Sharp's ribald satirical poem about youths gatecrashing a party, entitled "The Word Flashed Around The Arms"; the other another was the now famous Oz #6 cover photograph (pictured at right), which depicted Neville and others pretending to urinate into a wall fountain created by sculptor Tom Bass, which was mounted in the street facade of the Sydney offices of the P&O shipping line and which had recently been unveiled by Prime Minister Menzies.

Six flats in two weeks

I've had more flat tyres in the last two weeks than in the last 12 months. The weird thing is that after removing the tubes on some of those occasions, pumping them up and putting them through a bucket of water, I haven't been able to detect any air leaks - not a single bubble.

However, next morning, the tyre is flat as a pancake.

I've tried new tyres and new tubes - no dice. I wonder if I've annoyed somebody at work, and they're sneaking down to the garage to deflate my tyres during the day....

Thursday, 18 November 2010

Much cheaper than the Hubble

More photos from the Hubble Telescope?

Nope, just some paint left out in the backyard in the rain.


Wednesday photos

It's now Thursday, but these photos cover Monday to Wednesday.

Monday was a horrible day - hot and murky in the morning, wet as a Bangkok hooker in the afternoon. It was so hot and muggy during the morning, it was one of those days when I was wishing it would rain, just to cool me off.


This is what the paths looked like - completely empty. It was a lousy day for walking or riding.


Here is a very odd character - he's about to dismount and walk his bike around the rowing sheds. No one does that - and I mean no one. This must be Tuesday, as there was nothing and no one about on Monday to photograph. And it was raining too hard during the afternoon to take the camera out.


A typical scene on our new bike paths in town - a jogger running down the path, running away from the traffic, so that he has no idea what is tearing down the hill behind him. I saw a cyclist yell at a couple of pedestrians on the bike path this week - I'm fed up enough to start yelling too.


How cycling should be - very relaxed, in thongs. If we could just get rid of the compulsory helmet for relaxed riding, things would be grand.


I am not a complete Philistine

Seen in the Pitt St Mall this week. He's not doing it on the paving stones - he's rolled out a canvas and chalked over that (it's been raining a lot).


Why do governments feel the need to pour so much cash into "art", most of which is atrocious, when we can have things like this? The public was happy to fund this bloke - his buckets were full of coins (quite a lot of them gold), and I chucked in some myself. The public are much better arbiters of taste than bureaucrats and politicians.

Tuesday, 16 November 2010

Who are Green voters?

From Counterpoint on the ABC - read the transcript or listen to the podcast.

John Black: That's right, the National Party is traditionally run by wealthy people who represent poor people, and the Greens tends to be run by lower income people representing rich people but who seem to have a view that their constituency is decidedly bolshy in terms of economic policy when in fact there's absolutely no evidence of that at all, and in fact the evidence is to the contrary.

Paul Comrie-Thomson: So in fact if green voters see green political parties threatening their income stream, they'll dump them. Is that how you see it?

John Black: In a New York second. This is not rocket science. People vote politically as consumers, and I fall back on my old Marxist historians for that little piece of wisdom. People do not vote to lose money, that's a case in point. Your green voter now has shares, your green voter now doesn't have children. Because they don't have children they have money, they have investment homes, they have shares. The simple correlations between ownership of investments, including shares, and the top income group was +0.94. You don't get any stronger than that. I mean, share ownership is clustered in then top quartile, green votes are clustered in the top quartile. Green voters are born overseas, they're the kind of people who were getting $100,000+ in WA on the old AWAs. They were into them with their ears back. These are rich, cosmopolitan, internationally qualified people.

Sunday, 14 November 2010

Why do our national parks burn?

In my last post, I looked at the breakdown of staff in the DECCW. Now it's time to look at how they spend their budget.

The DECCW has a capital works program for the next few years of $309 million.

$6.4 million is being spent on buying up perpetual crown leases.

$7 million on satellite imagery.

$6.8 million on spatial data.

$19 million on establishing Brigalow/Nandewar (presumably a new park)

$69 million on land purchases

$23 million on establishing new parks

$45 million on rivers environmental restoration.

Improving fire, feral animal and weed control will get $993,000 in 2012-13.

$3.295 million was spent last year on bushfire management. For an agency that controls 11% of the state.

$3 million.

They probably spent most of it on consultant's reports, rather than actually making their properties more fire resistant.

In the section on the major achievements of the executive, I did find this:

Completed fire management strategies for all parks and reserves, and finished 59,202 hectares of hazard reduction burning which is the highest total ever completed by the National Parks and Wildlife Service.
Let's see - they have over 6 million hectares under their management. 59,202 hectares is 0.98% of the total. At this rate, it will only take them a century or so to get all that hazardous undergrowth cleared out.

Top brass vs rangers

More snippets from the DECCW annual report. Never read the warm and fluffy stuff with colour photos at the front - go straight to the appendixes. That's where all the dirt is buried.

When I think of the Department of the Environment, which includes the mob that runs our parks, I think of lots of buff blokes in green or blue shirts running around doing good stuff with trees and native animals.

Sadly, I am mistaken.

Here is a table from 2009 showing how employees are classified. I have re-ordered it from largest category to smallest.

DECC employees by classification

Policy, project and research 993
Administrative and clerical 844
Field 663
Manager positions 353
Ranger categories 303
Horticultural 146
Operations 136
Other 134
Senior officers and senior executive service 108
Trade 18
Total 3698

I'm not sure what "field" positions are, but I presume they involve running around getting your boots dirty. I hope.

Of the 3700 staff, from what I can gather, only about 1000 actually do work with trees and flowers and furry creatures. The rest are driving a desk.

Amazingly, there are only 303 rangers. They are outnumbered by the 353 managers, and even more incredibly, there are 108 senior officers and executives (and they have grown from 83 in 2007 to 108 in 2009).

To add insult to injury, for a department that manages so much land out in the scrub, 55% of their staff work in the Sydney metro area - presumably in a nice office somewhere.

The 303 rangers have to manage just over 5 million hectares of national parks, and 888,000 hectares of nature reserves and 448,000 hectares of conservation areas. This represents 8.39% of NSW.

Altogether, there are 793 community conservation areas, national parks, aboriginal areas, regional parks etc etc etc - in other words, there are 0.38 rangers per bit of land that the department manages.

There are also 48 declared wilderness areas that cover 1.9 million hectares - another 2.4% of NSW.

There are also six marine parks covering 345,100 hectares, and

And last but not least, there are just over 100 bits of land that have been acquired by the department, but have not been turned into reservations yet.

In other words, 303 rangers are looking after nearly 11% of the state. I think they might be spread a little thin. No wonder so many of them are infested with wild pigs, feral goats and weeds; and then they have a tendency to burn like buggery every few years.

More on the burning bit in my next post.

Government by committee

I had a look through the DECCW annual report today - that stands for the Department of the Environment, Climate Change and Water. Phew, no wonder they truncate it.

DECCW is a relatively small "super department", having only 3698 public servants. However, that doesn't stop the top executives from being very, very well paid. Here they are:

Ms Lisa Corbyn
Director General
$394,700

Mr Simon A Y Smith
Deputy Director General, Climate Change, Policy and Programs Group
$357,300

Ms Sally Barnes
Deputy Director General, Parks and Wildlife Group
$292,050

Mr Joe Woodward
Deputy Director General, Environment Protection and Regulation Group
$284,950

Mr Len Banks
Executive Director Scientific Services
$259,850

Ms Stephanie Cross
Executive Director Corporate Services
$236,000

Below is a graph that shows the number of taxpayers in each income range for 2009. I have drawn in a red arrow to show where the most lowly paid DECCW executive sits - in the 3rd bracket from the top. I can't show you where the top two sit, as they are off the chart - it only goes to $300,000.


There are only 40,000 people in the entire country that earn over $300,000, so I guess you can say that the DECCW executives aren't really doing the job for love of the environment. They must be doing because they love sitting on committees.

Lots of committees. I count about 70 committees that the DECCW runs. Around 800 people (public servants and members of the public) sit on these committees (I wonder what sort of fees they pay?)

I've sat on a few committees in my time, and the common thread running through all of them is that no work was done in them, and they had few meaningful outcomes. Yet DECCW is over run with them. I reckon their budget for tea and biscuits must be enormous.

Here's the list of 70 committees. It's quite amazing. I've also added in all the interdepartmental committees - I count about 125 of them, and the 22 significant statutory bodies that DECC has membership of.

Significant committees advising DECC

Aboriginal Cultural Heritage Advisory Committee
Aboriginal Water Trust Advisory Committee
Animal Ethics Committee
BioBanking Ministerial RCape Byron State Conservation Area Trust reference Group
Climate Change Fund Advisory Committee
Climate Change Science Research Network

Community Conservation Advisory Committees
Border Rivers/Gwydir CCAC
Central West CCAC
Namoi CCAC

Conservation Audit and Compliance Committee
Environmental Trust
Internal Audit Committee
Kangaroo Management Advisory Panel
Karst Management Advisory Committee
Load-based Licensing Technical Review Panel

Marine Parks Authority
Bateman’s Marine Park Advisory Committee
Cape Byron Marine Park Advisory Committee
Jervis Bay Marine Park Advisory Committee
Lord Howe Island Marine Park Authority Advisory Committee
Port Stephens–Great Lakes Marine Park Advisory Committee
Solitary Islands Marine Park Advisory Committee

National Parks and Wildlife Advisory Council

National Parks and Wildlife Regional Advisory Committees
Blue Mountains Region
Central Coast Hunter Range Region
Far South Coast Region
Far West Region
Hartley Historic Site
Hunter Region
Mid North Coast Region
North Coast Region
Northern Plains Region
Northern Rivers Region
Northern Tablelands Region
Snowy Mountains Region
South Coast Region
South West Slopes Region
Sydney North Region
Sydney South Region
Upper Darling Region
Western Rivers Region

Boards of Management
Biamanga National Park Board of Management
Gulaga National Park Board of Management
Mount Grenfell Historic Site Board of Management
Mutawintji Board of Management
Worimi Conservation Lands Board of Management

Co-management committees
Arakwal National Park Management Committee
Central Coast Hunter Range Regional Aboriginal Co-management Committee
Darug Peoples Advisory Committee
Githabul National Parks Management Committee
Goobang National Park and Snake Rock Aboriginal Area Committee
Menindee Aboriginal Elders Council
Mungo National Park Joint Management Advisory Committee
Paroo Darling National Park Co-management Group
Gawambaraay Pilliga Co-Management Committee

NSW Climate Change Council
NSW Council on Environmental Education
NSW Landcare Committee
NSW Scientific Committee
NSW State of the Environment Advisory Committee
Radiation Advisory Council
Waste Service Performance Improvement Payment Advisory Group

World Heritage Areas advisory committees
Greater Blue Mountains WHA Advisory Committee
Gondwana Rainforests Community Advisory Committee
Gondwana Rainforests Technical and Scientific Advisory Committee
Willandra Lakes WHA Advisory Committee

DECC membership of other significant statutory bodies

Brigalow and Nandewar Community Conservation Council
Bush Fire Co-ordinating Committee
Lake Illawarra Authority
Lord Howe Island Board
Natural Resources Advisory Council
Nature Conservation Trust
NSW Heritage Council
Radiation Health Committee
State Contracts Control Board
State Heritage Register Committee
Sydney Harbour Federation Trust

DECC membership of significant interdepartmental committees

Adaptation Senior Officer’s Group
Australian Collaborative Rangelands Information System Management Committee
Australian Government and New South Wales Government Natural Resource Management Joint Steering Committee
Australian Transport Council, Fuel Efficiency Working Group
Biofuels Expert Panel
Board of Surveyors and Spatial Information – Spatial Information Committee
Chief Executive Committee
Climate Change CEO’s Cluster
Climate Change Working Group
Commonwealth Fuel Standards Consultative Committee
Council of Australian Governments Adaptation Subgroup
Council of Australian Governments Working Group on Climate Change and Water
Counter Terrorism CEO’s Cluster
Data and Information Management Working Group – NSW Remote Sensing Subcommittee
Data and Information Management Working Group – NSW Spatial Data Infrastructure Subcommittee
DECC/CMA/ServiceFirst Shared Services Steering Committee
Economic and Business CEO’s Cluster
Environment Protection and Heritage Council Air Quality Working Group
Environment Protection and Heritage Council/Australian Transport Council Fuel Efficiency Working Group
Environment Protection and Heritage Council Working Group on Noise Labelling
Environment Protection and Heritage Ministerial Council Standing Committee
Environmental Trust Subcommittee: Clean Air, Healthy Communities
Environmental Trust Subcommittee: NSW RiverBank
Environmental Trust Technical Committee: Restoration and Rehabilitation Program
Gondwana Rainforests of Australia World Heritage Area Steering Committee
Intensive Agriculture Consultative Committee
Land Supply CEO Group
Metropolitan Planning CEO Group
Metropolitan Water CEO Committee
Monitoring, Evaluation and Reporting Management Team
Murray–Darling Basin Authority Acid Sulfate Soils Advisory Board
Murray–Darling Basin Authority Acid Sulfate Soils Scientific Reference Panel
Murray–Darling Basin Commission
Murray–Darling Basin Commission Salinity Management in Catchments Task Force
National Coordination Committee – Aquatic Ecosystems Task Group
National Coordination Committee – Biodiversity Working Group
National Coordination Committee – Executive Steering Committee for Australian Land Use Mapping
National Coordination Committee – Executive Steering Committee for Australian Vegetation Information
National Coordination Committee – River Health Contact Group
National Coordination Committee for Salinity Information
National Coordination Committee – Technical Advisory Group for Australian Landuse Mapping
National Committee on Soil and Terrain Information
National Environment Protection Council
National Packaging Covenant Council
Natural Resources and Environment CEO’s Cluster
Natural Resource Management Ministerial Council Standing Committee
Natural Resource Policies and Program Committee
NSW Chief Information Officers Executive Council
NSW Electric Vehicle Taskforce
NSW Feed-in Tariffs Taskforce
NSW National Oil Spill Plan Executive Committee
NSW Research Scientist Classification Committee
NSW Soil Policy Working Group
Planning and Approvals CEO’s Cluster
Premier’s Council for Active Living
Senior Officers’ Group on Energy Efficiency (reporting to the Council of Australian Governments)
State Emergency Management Committee
Sustainability CEO’s Cluster
The Living Murray Environmental Watering Group
The Living Murray MDBC Committee
Transport, Planning and Infrastructure CEO’s Cluster
Two Ways Together Coordinating Committee
Wetlands and Waterbirds Task Force